Performance Tracking

PERFORMANCE REPORT

Turn Field Activity into Actionable Insights

Get a clear, real-time view of field-force performance, planning effectiveness, doctor coverage, and engagement activities. Analyse key performance indicators through structured reports and make data-driven decisions to improve productivity and territory coverage.
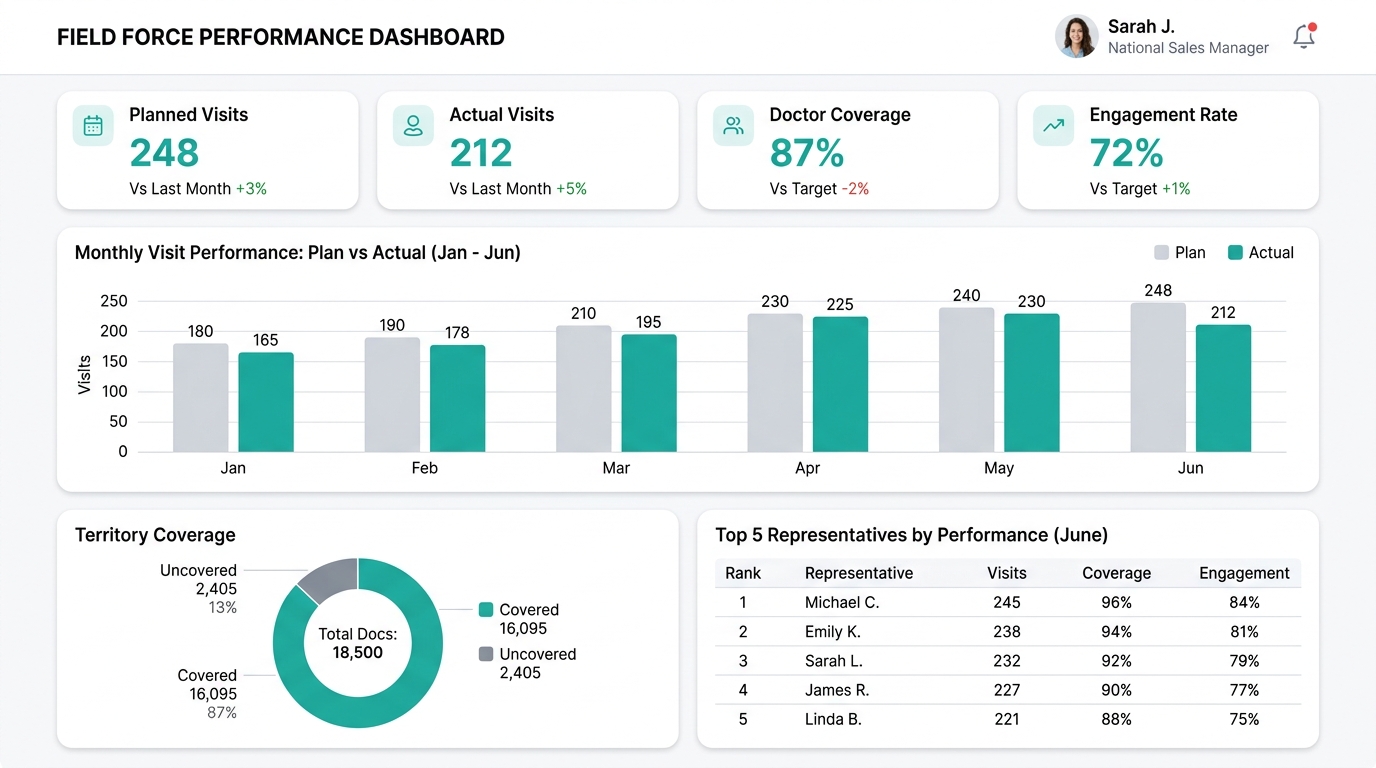
Performance analytics dashboard
Live Analytics
87% Coverage

PERFORMANCE AT A GLANCE

See What Your Field Team
Is Really Achieving

Bring field activity, planning, coverage, and engagement data together to understand performance at every level.

248

Planned Visits

212

Actual Visits

87%

Doctor Coverage

72%

Engagement Rate

KEY FEATURES

Every Report You Need.
One Clear View.

01 FEATURE

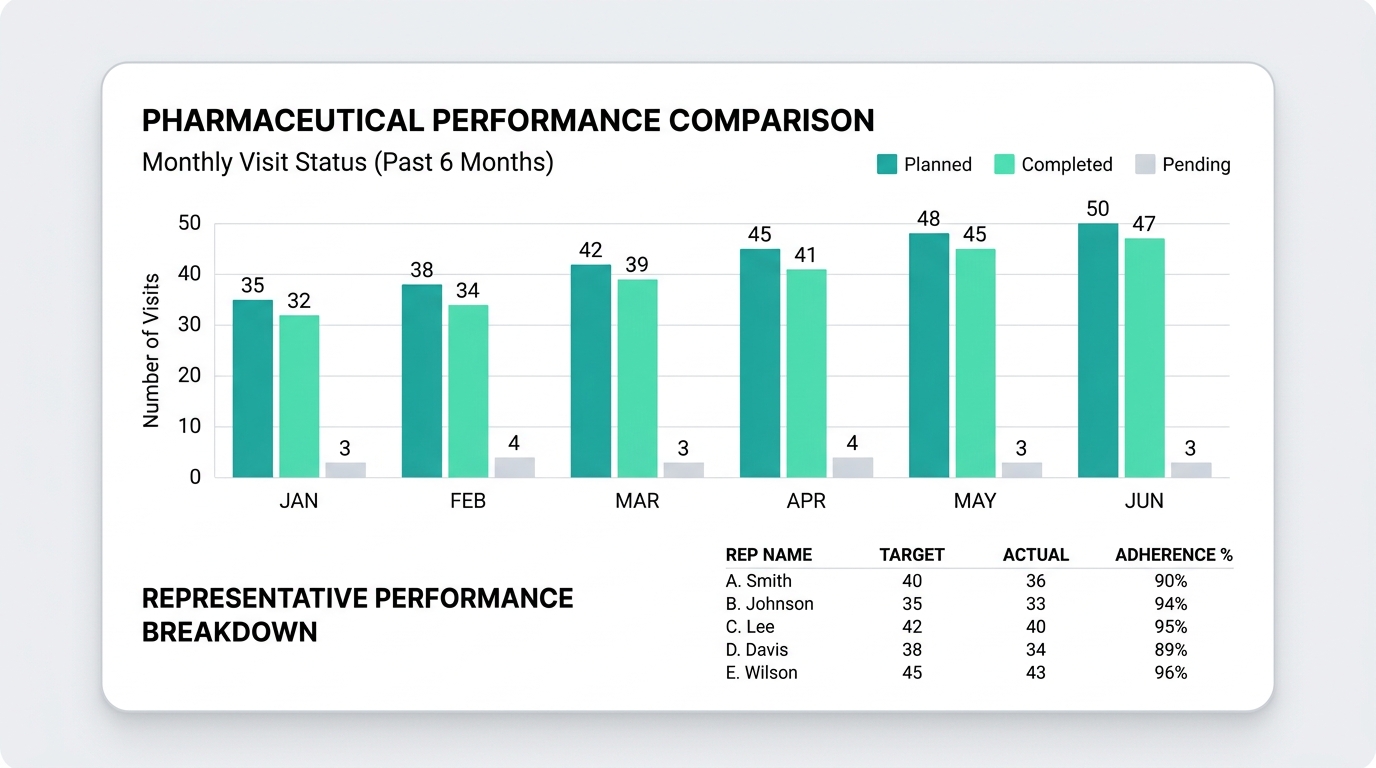
Monthly Plan vs. Actual Performance

Compare planned activities with actual execution to identify gaps, measure adherence, and improve future planning. Get a clear month-over-month view of how your field team is performing against their targets.

Plan vs. actual comparison

Adherence tracking

Representative performance breakdown

Monthly plan vs actual performance chart
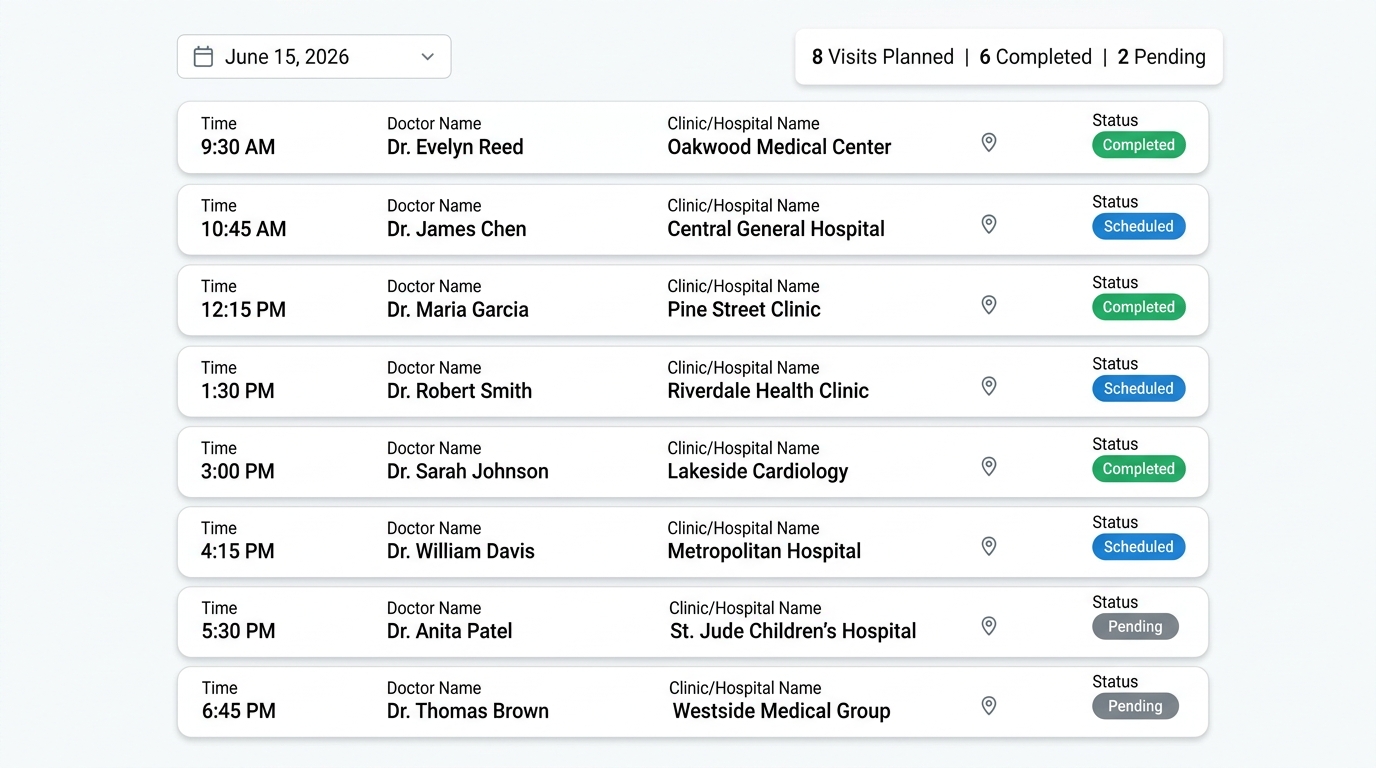
Daily visit reports interface
Daily Log
02 FEATURE

Daily Visit Reports

Track daily doctor and influencer visits with detailed activity reports for clear visibility into field productivity. Every visit is logged with time, location, doctor details, and completion status.

Visit timeline with status

Doctor & location details

Planned vs completed summary

03 FEATURE

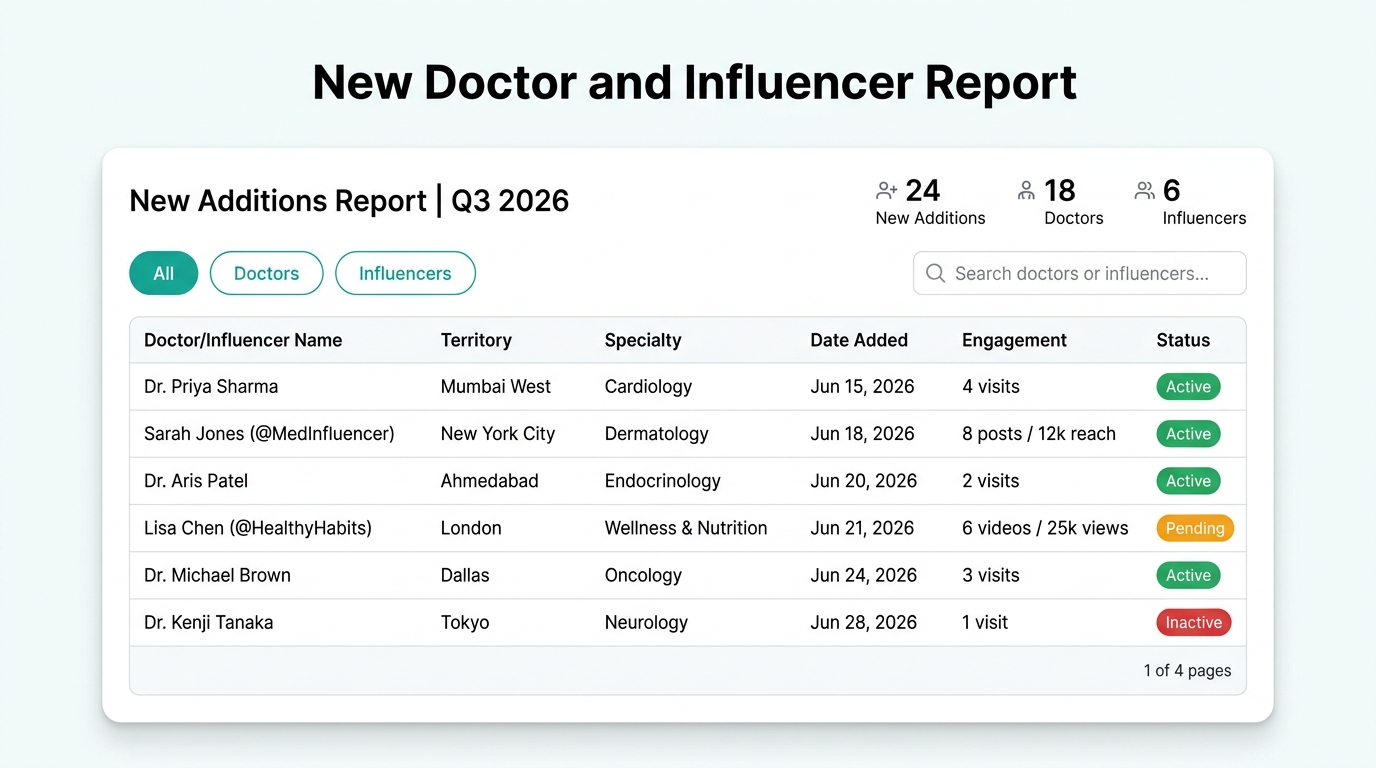
New Doctor & Influencer Reports

Monitor newly added doctors and influencers along with their engagement activities for better territory management. Filter by type, search by name, and track engagement status across your growing network.

New additions tracking

Territory & specialty mapping

Engagement status monitoring

New doctor and influencer report table
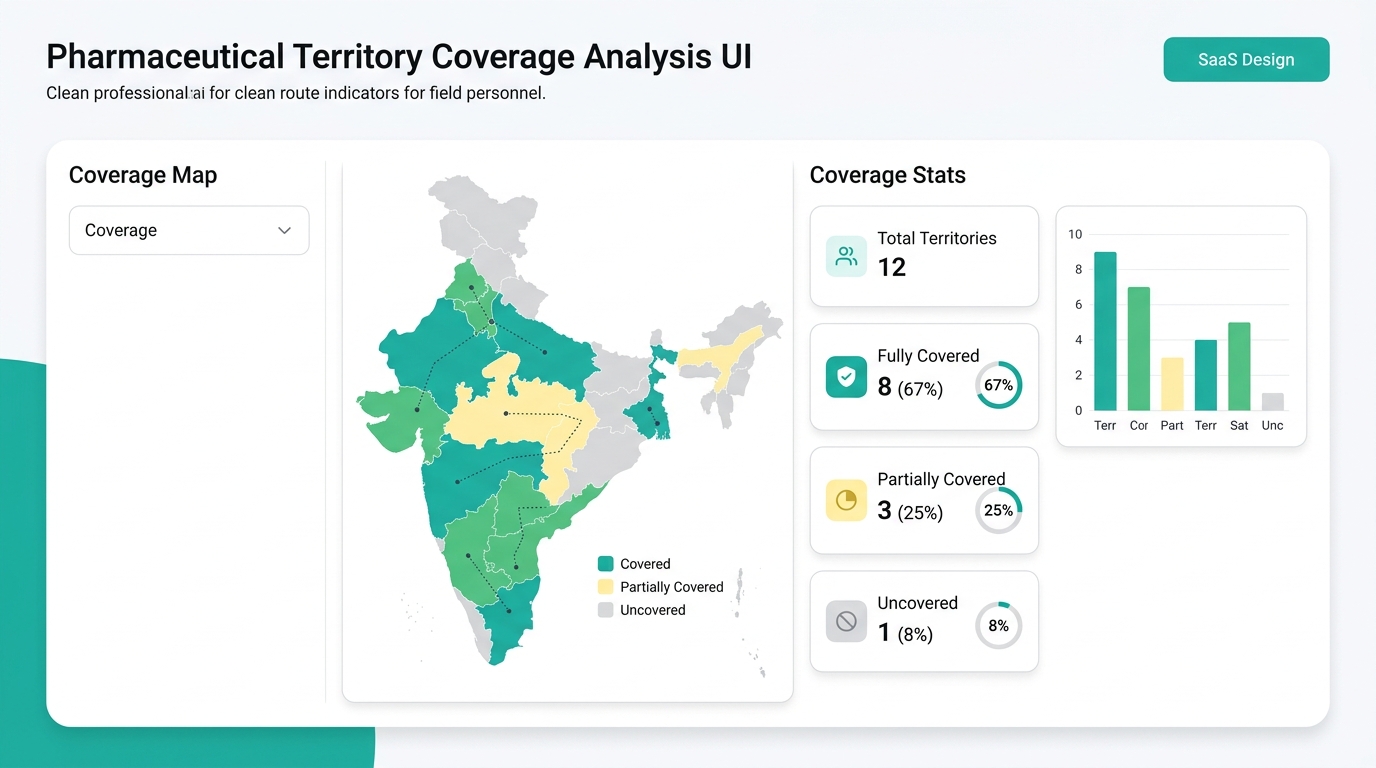
Territory coverage analysis dashboard
67% Covered
04 FEATURE

Monthly Coverage Analysis

Analyse doctor and influencer coverage across territories and routes to identify gaps and maximize field reach. Visualize covered, partially covered, and uncovered areas through an interactive map-based dashboard.

Territory map visualization

Coverage percentage breakdown

Route & gap identification

05 FEATURE

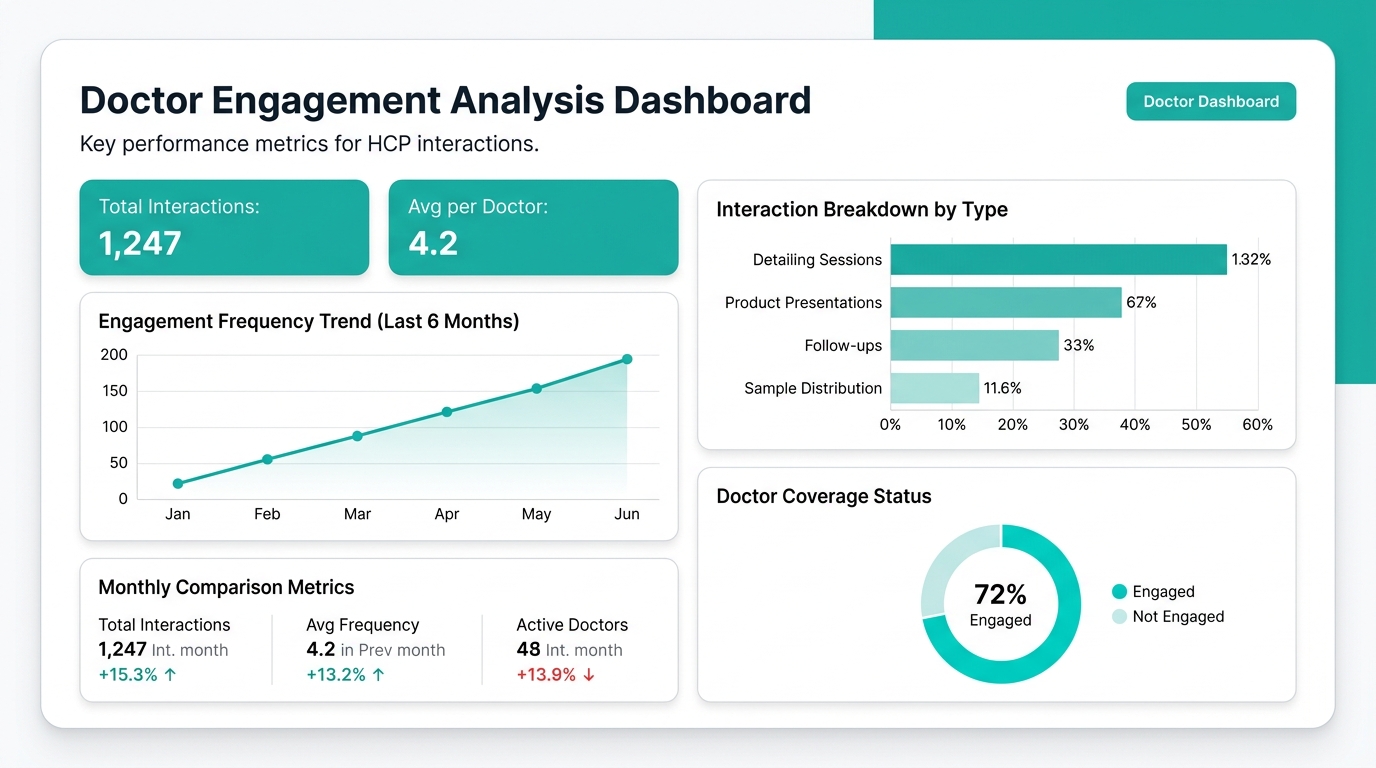
Doctor Engagement Analysis

Measure interaction frequency and engagement trends to build stronger and more effective doctor relationships. Track total interactions, average engagement per doctor, and identify opportunities for deeper engagement.

Engagement frequency trends

Interaction type breakdown

Monthly comparison metrics

Doctor engagement analysis dashboard
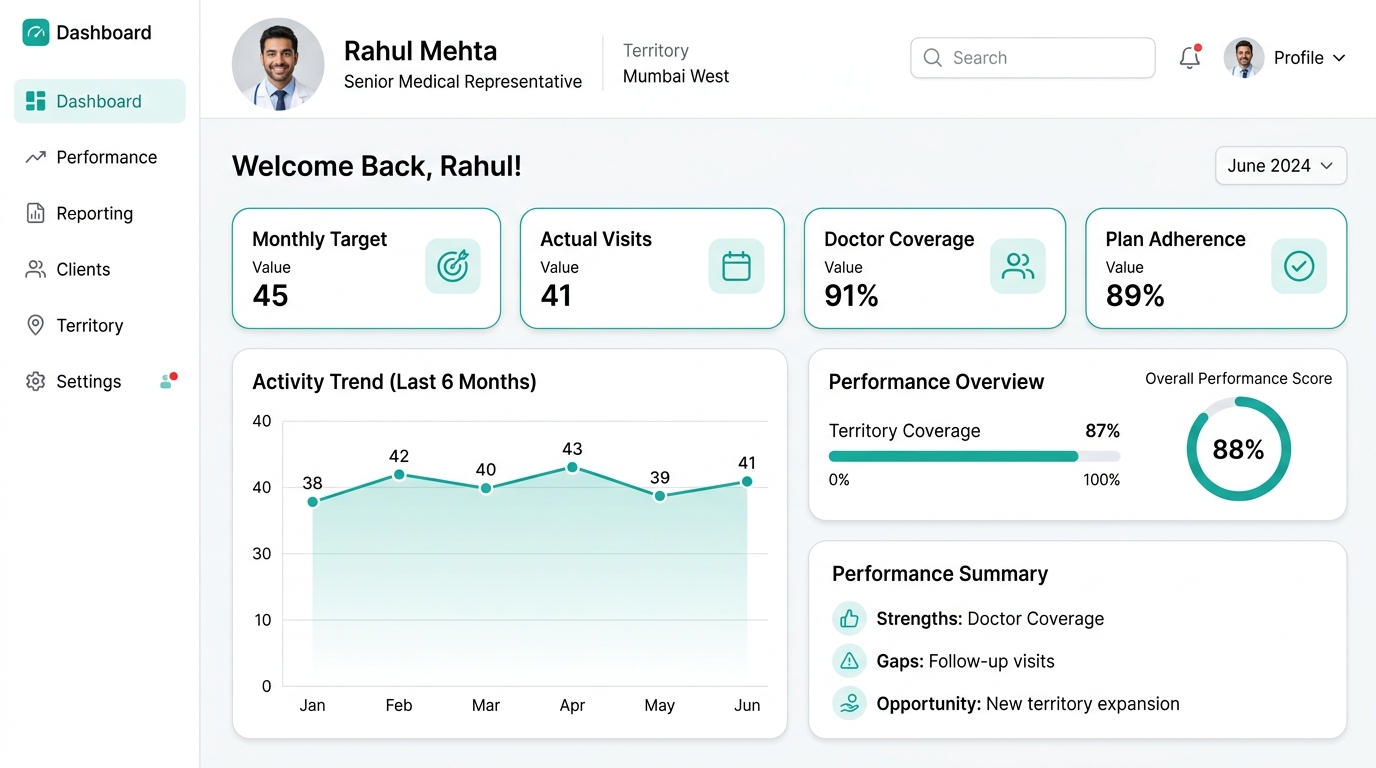
Individual representative performance dashboard
Score: 88%

INDIVIDUAL PERFORMANCE

Know How Every Representative Performs

Get an individual performance overview covering visits, coverage, planning, and execution — helping managers identify strengths, gaps, and opportunities for every team member.

Individual KPI dashboards

Activity trend analysis

Strengths & gap identification

From Field Data to
Better Decisions

01

Collect

Capture field activities and visit data automatically.

02

Analyse

Turn activity into meaningful performance insights.

03

Identify

Spot gaps in coverage, planning, and execution.

04

Act

Make smarter decisions to improve field performance.

Upgrade the Way Your Pharma Team Works

Simplify field operations, improve doctor engagement, and gain complete visibility.